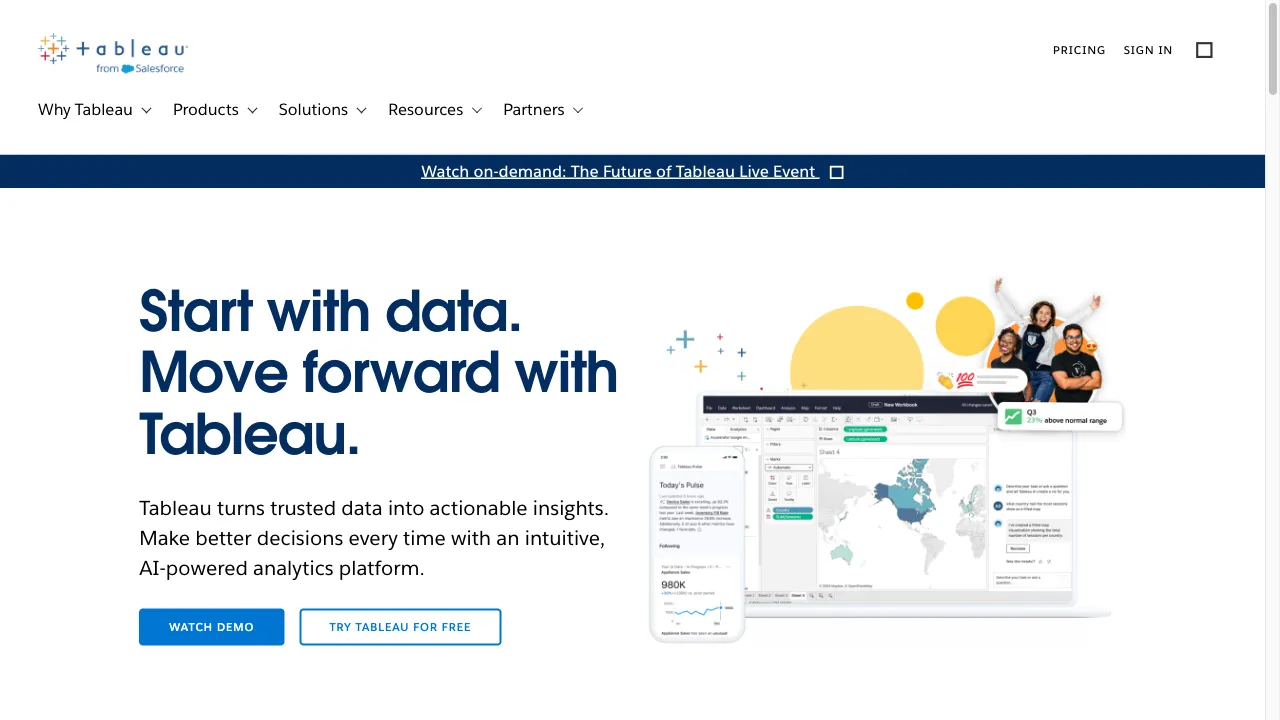
란 무엇인가 Tableau?
Tableau is a powerful business intelligence (BI) and data visualization tool widely used by organizations to convert raw data into actionable insights. It allows users to create interactive and shareable dashboards that depict trends and variations in data through graphs and charts. Tableau's ability to connect to various data sources, including spreadsheets, databases, and cloud services, enhances its versatility for data analysis. This report provides a comprehensive analysis of Tableau, covering its features, use cases, usability, pros and cons, and user experiences, supported by various reputable sources.
Tableau 트래픽 분석
Tableau 월간 방문
Tableau 상위 방문 국가
Tableau 상위 키워드
Tableau 웹사이트 트래픽 소스
Tableau 기능
Data Connectivity
Tableau supports connections to various data sources, including SQL databases, cloud-based data warehouses, and spreadsheets. This flexibility allows users to integrate data from multiple sources into a single dashboard.
Interactive Dashboards
Users can create dashboards that are visually appealing and interactive, allowing for data drilling and filtering to gain deeper insights.
Advanced Analytics
Tableau offers advanced analytics features like trend lines and forecasting, enabling users to perform complex data analysis without extensive programming skills.
Collaboration and Sharing
Facilitates collaboration by allowing users to share dashboards and reports, which is particularly useful for organizations requiring team-based data analysis.
Integration with Salesforce
As part of the Salesforce ecosystem, Tableau offers seamless integration with Salesforce CRM, enabling users to leverage CRM data for enhanced analytics.
Tableau 장점
Powerful Visualization
Tableau is highly regarded for its ability to create visually appealing and interactive dashboards, which is consistently highlighted in positive user reviews.
Data Integration
The tool's ability to connect to a wide range of data sources is a significant advantage, allowing users to consolidate data from multiple platforms.
User-Friendly Interface
Despite its advanced capabilities, Tableau's drag-and-drop interface makes it accessible to users with varying levels of technical expertise.
Tableau 단점
High Cost
One of the most frequently cited drawbacks of Tableau is its high cost, particularly for organizations with many users. The licensing fees can be prohibitive for small to medium-sized businesses.
Steep Learning Curve
While user-friendly, mastering Tableau's full range of features can be challenging, especially for users who are not tech-savvy.
Limited Customization
Some users have expressed frustration with the limited customization options for visualizations, which can restrict the ability to tailor dashboards to specific needs.
사용 방법 Tableau
Step 1: Know Your Audience
When designing dashboards, it is crucial to understand the audience's needs and level of expertise. Tailoring the dashboard to the audience ensures that the visualizations are both informative and accessible.
Step 2: Design for Performance
Efficient dashboards are designed with performance in mind, including optimizing data queries, limiting the number of views, and ensuring that dashboards load quickly.
Step 3: Leverage Interactivity
Incorporating interactive elements such as filters and drill-downs can enhance the user experience and encourage exploration of the data.
사용자 Tableau
Sales and Marketing
Organizations use Tableau to analyze sales data, track marketing campaign performance, and forecast future sales trends, helping identify key sales drivers and market opportunities.
Finance
Financial analysts use Tableau to monitor financial performance, manage budgets, and conduct risk analysis, allowing for detailed financial modeling and scenario analysis.
Healthcare
In healthcare, Tableau tracks patient outcomes, manages hospital resources, and analyzes clinical data, aiding healthcare providers in making data-driven decisions.
Human Resources
HR departments leverage Tableau to analyze employee data, track recruitment metrics, and assess workforce diversity, helping identify trends for informed decision-making.
댓글
"Tableau has transformed our data analysis process! The dashboards are visually stunning and easy to share with the team."
"The learning curve is steep, but once you get the hang of it, Tableau is incredibly powerful for data visualization."
"I love how Tableau integrates with our existing data sources, making it easy to pull in information from various platforms."
"While the cost is on the higher side, the insights we gain from using Tableau are invaluable for our business."
참고 자료
- [2] Tableau 소프트웨어 리뷰: 장단점.URL:https://www.sam-solutions.com/blog/tableau-software-review-pros-and-cons-of-a-bi-solution-for-data-visualization/
- [4] 효과적인 대시보드를 위한 모범 사례.URL:https://help.tableau.com/current/pro/desktop/en-us/dashboards_best_practices.htm
Tableau 대안

비즈니스 애플리케이션을 위한 동적인 온라인 마켓플레이스.

AI 도구를 발견하기 위한 종합 플랫폼.

강력한 JavaScript 차트 라이브러리로 상호작용 데이터 시각화.

모든 기능이 통합된 협업 플랫폼

모든 기능을 갖춘 고객 서비스 플랫폼.

AI-powered workplace assistant for streamlined information retrieval.

Agnai Chat is a versatile conversational AI platform.

AI-driven platform for unstructured data management.

Leading data marketplace connecting providers and consumers.

운영을 향상시키기 위해 설계된 생산성 도구 모음입니다.

AI 기반 회의 녹음 및 노트 작성 플랫폼.

웹 데이터 추출을 위한 자동화 도구입니다.

스프레드시트 생산성을 향상시키는 혁신적인 AI 도구입니다.

팀을 위한 혁신적인 온라인 스프레드시트 플랫폼.

AI platform for business automation and insights.

AI 도구 추적을 위한 종합 플랫폼입니다.